Delta NT
Delta NT
Delta NT
Delta NT
Record detailed vehicle studies in
heavy traffic, simple axle volumes, or anything in between
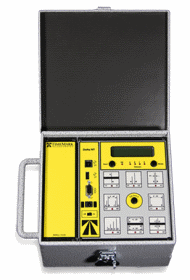
This is our most versatile data collector. Four sensor inputs support all of our road tube layouts. That includes a four-tube configuration that can separate and classify vehicles in adjacent lanes at high volume locations. And it’s all inside a durable sheet metal case that won’t weigh you down.
Get Started with Confidence
When you turn the counter on, the LCD screen displays the battery voltage and the date and time on the counter clock. If everything looks right, just press the Start button twice to start recording. A message on the screen will confirm it has started. The counter can also be configured to remind you to attach your GPS device if the site coordinates have not been entered yet.
When you turn the counter on, the LCD screen displays the battery voltage and the date and time on the counter clock. If everything looks right, just press the Start button twice to start recording. A message on the screen will confirm it has started. The counter can also be configured to remind you to attach your GPS device if the site coordinates have not been entered yet.
When you turn the counter on, the LCD screen displays the battery voltage and the date and time on the counter clock. If everything looks right, just press the Start button twice to start recording. A message on the screen will confirm it has started. The counter can also be configured to remind you to attach your GPS device if the site coordinates have not been entered yet.
When you turn the counter on, the LCD screen displays the battery voltage and the date and time on the counter clock. If everything looks right, just press the Start button twice to start recording. A message on the screen will confirm it has started. The counter can also be configured to remind you to attach your GPS device if the site coordinates have not been entered yet.
Save the Layout on the Spot
Save the Layout on the Spot
Save the Layout on the Spot
Save the Layout on the Spot


It isn’t necessary to program the Delta NT before a study. Details about the site and how the data was recorded can be entered from your field notes later using the VIASsoftware. But it is also very easy to tell the counter how the tubes have been laid out so that can be saved with the file. Before starting the counter, switch to LED mode and use the Select button to choose the diagram that matches your tube layout. Sensor spacing measurements must still be entered later.
It isn’t necessary to program the Delta NT before a study. Details about the site and how the data was recorded can be entered from your field notes later using the VIASsoftware. But it is also very easy to tell the counter how the tubes have been laid out so that can be saved with the file. Before starting the counter, switch to LED mode and use the Select button to choose the diagram that matches your tube layout. Sensor spacing measurements must still be entered later.
It isn’t necessary to program the Delta NT before a study. Details about the site and how the data was recorded can be entered from your field notes later using the VIASsoftware. But it is also very easy to tell the counter how the tubes have been laid out so that can be saved with the file. Before starting the counter, switch to LED mode and use the Select button to choose the diagram that matches your tube layout. Sensor spacing measurements must still be entered later.
It isn’t necessary to program the Delta NT before a study. Details about the site and how the data was recorded can be entered from your field notes later using the VIASsoftware. But it is also very easy to tell the counter how the tubes have been laid out so that can be saved with the file. Before starting the counter, switch to LED mode and use the Select button to choose the diagram that matches your tube layout. Sensor spacing measurements must still be entered later.
Easily Monitor Study Progress
Easily Monitor Study Progress
Easily Monitor Study Progress
Easily Monitor Study Progress
During a long study, it’s a good idea to visit the site periodically to make sure everything is still in place and working. LED lights let you quickly see whether every sensor is still recording hits. The LCD screen shows even more information. You can check the battery voltage or see how many strikes have been recorded by each sensor. Strike totals for the first 24 hours only and the entire study are displayed.
During a long study, it’s a good idea to visit the site periodically to make sure everything is still in place and working. LED lights let you quickly see whether every sensor is still recording hits. The LCD screen shows even more information. You can check the battery voltage or see how many strikes have been recorded by each sensor. Strike totals for the first 24 hours only and the entire study are displayed.
During a long study, it’s a good idea to visit the site periodically to make sure everything is still in place and working. LED lights let you quickly see whether every sensor is still recording hits. The LCD screen shows even more information. You can check the battery voltage or see how many strikes have been recorded by each sensor. Strike totals for the first 24 hours only and the entire study are displayed.
During a long study, it’s a good idea to visit the site periodically to make sure everything is still in place and working. LED lights let you quickly see whether every sensor is still recording hits. The LCD screen shows even more information. You can check the battery voltage or see how many strikes have been recorded by each sensor. Strike totals for the first 24 hours only and the entire study are displayed.
Incorporated
Types of Studies
The TimeMark system performs all of the following traffic studies. Depending on how it was laid out and recorded, a road tube file can usually be analyzed for several different kinds of information.
Volume
How much traffic was there? When was the peak hour? Axle Volume studies will give you an estimate using a volume factor or average number of axle per vehicle. Vehicle Volume gets rid of the estimates and figures out which vehicle each strike came from. This gives you more accurate results when the traffic is a mix of vehicle classes.

Axle Classification
Find out what kind of traffic uses a route and when. VIAS comes with a 13-category classification scheme that can be used for reporting vehicle classification data to the U.S. Federal Highway Administration (FHWA). Only need to compare the number of passenger vehicles to trucks? Use different classification tables on the same data to tailor the information to your audience.
Speed
See how fast each vehicle was going or just find the average free-flow speed. VIASdoes both vehicle and one-sensor speed studies. Either kind of study gives you statistics like the pace range, minimum and maximum speeds, and percentiles. These are calculated from the individual vehicle speeds, not interpolated, so they won’t change if you group the results in different ways.
Gap
Gap studies are often used to decide if a traffic control device is needed at a location. Is there enough time for a pedestrian or car to cross the road and how often will they get the chance? To see how long the gaps are, use a Vehicle Gap or Axle Gap binned study. For a traffic warrant analysis, the Axle Gap Count study counts gaps using the “adequate size” you specify.

Per Vehicle
Examine the details of every vehicle that was detected. When did it go by? Which lane was it in? What kind of vehicle was it? How fast was it going? Filters let you examine just the traffic you want such as speeding vehicles or commercial trucks.
Intersection Turning Movement
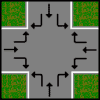
This is a manual count study. One or more people use an Epsilon or Epsilon NT counter to count or classify vehicles as they travel through an intersection. Certain button combinations can be assigned for counting pedestrians. Vehicle peak hour volume information is also available.

